肥胖及相关代谢指标与膝骨关节炎的关联: 基于中国中老年人群的横断面研究
摘要:
目的
基于中国健康与养老追踪调查(China Health and Retirement Longitudinal Study, CHARLS)数据, 分析肥胖及相关代谢指标与中老年人群(≥45岁)膝骨关节炎(knee osteoarthritis, KOA)发病风险的关系。
方法
提取CHARLS数据库中2011—2012年和2015—2016年2个调查周期的数据, 收集肥胖指标[体质量指数(body mass index, BMI)、腰围(waist circumference, WC)、腰高比(waist-to-height ratio, WHtR)、内脏脂肪指数(visceral adiposity index, VAI)、体型指数(a body shape index, ABSI)、体圆指数(body roundness index, BRI)、脂质积累指数(lipid accumulation product, LAP)、圆锥指数(conicity index, CI)、中国内脏脂肪指数(Chinese visceral adiposity index, CVAI)]和代谢指标[甘油三酯-葡萄糖指数(triglyceride glucose index, TyG)、TyG-BMI、TyG-WC、TyG-WHtR]以及协变量(包括一般人口学特征、生活方式、健康状况)资料, 采用多因素Logistic回归分析构建3种模型, 根据性别亚组分析关联异质性, 构建受试者工作特征(receiver operating characteristic, ROC)曲线并计算曲线下面积(area under the curve, AUC), 评估各项指标对KOA的诊断效能。
结果
共纳入受试者9527名, KOA患病率为9.59%(914/9527)。线性回归校正混杂因素后发现, BMI(OR=1.02, 95% CI: 1.00~1.04, P=0.048)、BRI(OR=1.06, 95% CI: 1.01~1.13, P=0.030)、LAP(OR=1.03, 95% CI: 1.00~1.05, P=0.020)、TyG-BMI(OR=1.02, 95% CI: 1.00~1.05, P=0.020)和TyG-WHtR(OR=1.13, 95% CI: 1.02~1.25, P=0.020) 与KOA存在显著正相关。亚组分析显示, 在女性受试者中, BMI(OR=1.03, 95% CI: 1.01~1.06, P=0.020)、WHtR(OR=1.18, 95% CI: 1.02~1.36, P=0.020)、BRI(OR=1.08, 95% CI: 1.01~1.16, P=0.020)、LAP(OR=1.03, 95% CI: 1.01~1.06, P=0.020)、CVAI(OR=1.04, 95% CI: 1.01~1.07, P=0.009)、TyG-BMI(OR=1.03, 95% CI: 1.01~1.06, P=0.006)、TyG-WC(OR=1.10, 95% CI: 1.01~1.19, P=0.020)、TyG-WHtR(OR=1.18, 95% CI: 1.04~1.34, P=0.010)与KOA的发生均呈显著正相关; 而在男性受试者中, 所有指标与KOA均不存在显著关联(P均>0.05)。检验性别与肥胖及代谢指标的交互作用发现, WC(P=0.010)、CVAI(P=0.002)和TyG-WC(P=0.020)与KOA之间的关联在男女之间存在显著差异。ROC诊断效能评估显示, 各项指标的诊断效能均有限[BRI(AUC=0.547, 95% CI: 0.526~0.567)、TyG-WHtR(AUC=0.544, 95% CI: 0.524~0.564)、其余AUC值均≤0.530]。
结论
BMI、BRI、LAP、TyG-BMI、TyG-WHtR可作为中老年女性人群KOA风险评估的辅助指标, 但其独立筛查价值有限, 需结合临床评估和其他风险因素综合判断。
关键词: 膝骨关节炎 / 肥胖 / 代谢 / 性别差异 / 中国人群Abstract:
Objective
To investigate the association between obesity-related metabolic indices and the risk of knee osteoarthritis(KOA) in middle-aged and older Chinese adults(≥45 years) using data from the China Health and Retirement Longitudinal Study(CHARLS).
Methods
Data from two CHARLS survey waves(2011—2012 and 2015—2016) were analyzed. Obesity indices—including body mass index(BMI), waist circumference(WC), waist-to-height ratio(WHtR), visceral adiposity index(VAI), a body shape index(ABSI), body roundness index(BRI), lipid accumulation product(LAP), conicity index(CI), and Chinese visceral adiposity index(CVAI)-and metabolic indices-triglyceride glucose index(TyG), TyG-BMI, TyG-WC, and TyG-WHtR-were collected. Covariates comprised demographic characteristics, lifestyle factors, and health status. Three multivariate logistic regression models were constructed. Sex-subgroup analyses assessed heterogeneity, and receiver operating characteristic(ROC) curves with area under the curve(AUC) were used to evaluate diagnostic performance.
Results
Among 9527 participants, the prevalence of KOA was 9.59%(914/9527). After adjusting for confounders, linear regression revealed significant positive associations between KOA and BMI(OR=1.02, 95% CI: 1.00-1.04, P=0.048), BRI(OR=1.06, 95% CI: 1.01-1.13, P=0.030), LAP(OR=1.03, 95% CI: 1.00-1.05, P=0.020), TyG-BMI(OR=1.02, 95% CI: 1.00-1.05, P=0.020), and TyG-WHtR(OR=1.13, 95% CI: 1.02-1.25, P=0.020). Sex-stratified analyses showed that in women, BMI(OR=1.03, 95% CI: 1.01-1.06, P=0.020), WHtR(OR=1.18, 95% CI: 1.02-1.36, P=0.020), BRI(OR=1.08, 95% CI: 1.01-1.16, P=0.020), LAP(OR=1.03, 95% CI: 1.01-1.06, P=0.020), CVAI(OR=1.04, 95% CI: 1.01-1.07, P=0.009), TyG-BMI(OR=1.03, 95% CI: 1.01-1.06, P=0.006), TyG-WC(OR=1.10, 95% CI: 1.01-1.19, P=0.02), and TyG-WHtR(OR=1.18, 95% CI: 1.04-1.34, P=0.010) were positively associated with KOA, whereas no significant associations were observed in men(P > 0.05 for all indices). Significant sex interactions were found for WC(P=0.010), CVAI(P=0.002), and TyG-WC(P=0.020). ROC analysis indicated limited diagnostic utility for all indices[BRI(AUC=0.547, 95% CI: 0.526-0.567), TyG-WHtR(AUC=0.544, 95% CI: 0.524-0.564), others ≤0.530].
Conclusions
BMI, BRI, LAP, TyG-BMI, and TyG-WHtR may serve as auxiliary indicators for KOA risk assessment in middle-aged and older women, but their standalone screening value remains modest. Clinical evaluation and integration with other risk factors are recommended for comprehensive risk stratification.
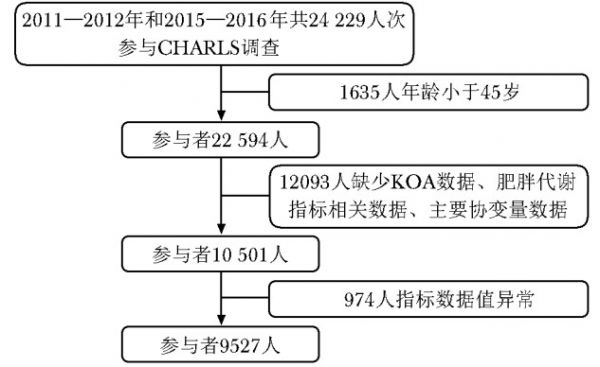
图 1 受试者筛选流程图
KOA(knee osteoarthritis): 膝骨关节炎
Figure 1. Subject screening flowchart
表 1 肥胖代谢指标计算公式及标准化处理
Table 1 Formulas and Standardized Table for Obesity Metabolic Indicators
指标 计算公式 标准化处理 肥胖指标 WC 直接测量[16] WC×10 BMI 体重/身高[17] - WHtR WC/身高[18] WHtR×10 VAI 男性: [WC/(39.68+1.88×BMI)]×(TG/1.03)×(1.31/HDL)[12] VAI×100 女性: [WC/(36.58+1.89×BMI)]×(TG/0.81)×(1.52/HDL)[12] ABSI WC/[BMI(2/3)×身高(1/2)][19] ABSI×100 BRI 364.2-365.5×sqrt〔1-[(WC/(2π)]2/(0.5×身高)2)〕[12] - LAP 男性: (WC-65)×TG[12] LAP /10 女性: (WC-58)×TG[12] CI WC/(0.109×sqrt(体重/身高)[12] CI×10 CVAI 男性: -267.93+0.68×年龄+0.03×BMI+4.00×WC+22.00×log10(TG)-16.32×HDL[20] CVAI/10 女性: -187.32+1.71×年龄+4.32×BMI+1.12×WC+39.76×log10(TG)-11.66×HDL[20] 代谢指标 TyG ln(TG×葡萄糖/2)[12] - TyG-BMI TyG×BMI[18] TyG-BMI /10 TyG-WC TyG×WC[18] - TyG-WHtR TyG×WHtR[18] - WC(waist circumference):腰围;BMI(body mass index):体质量指数;WHtR(waist-to-height ratio):腰高比;VAI(visceral adiposity index):内脏脂肪指数;ABSI(a body shape index):体型指数;BRI(body roundness index):体圆指数;LAP(lipid accumulation product):脂质积累指数;CI(conicity index):圆锥指数;CVAI(chinese visceral adiposity index):中国内脏脂肪指数;HDL(high-density lipoprotein cholesterol):高密度脂蛋白胆固醇;TyG(triglyceride glucose index):甘油三酯-葡萄糖指数表 2 9527名受试者的基线特征比较
Table 2 Comparison of baseline characteristics among 9527 participants
指标 无膝骨关节炎(n=8613) 膝骨关节炎
(n=914) P值 年龄(x±s, 岁) 58.97±9.36 60.04±8.67 <0.001 性别[n(%)] <0.001 女性 4461(51.79) 614(67.18) 男性 4152(48.21) 300(32.82) 受教育程度[n(%)] <0.001 高中及以上 939(10.90) 38(4.16) 初中 1818(21.11) 129(14.11) 小学 1950(22.64) 198(21.66) 小学以下 3906(45.35) 549(60.07) 婚姻状况[n(%)] 0.004 其他 986(11.45) 135(14.77) 已婚 7627(88.55) 779(85.23) 居住地[n(%)] <0.001 城市 3209(37.26) 220(24.07) 农村 5404(62.74) 694(75.93) 运动状态[n(%)] 0.020 不锻炼 5222(60.63) 539(58.97) 轻度锻炼 888(10.31) 73(7.99) 中度锻炼 1153(13.39) 131(14.33) 重度锻炼 1350(15.67) 171(18.71) 饮酒状态[n(%)] <0.001 从不饮酒 4959(57.58) 584(63.89) 过去饮酒 728(8.45) 99(10.83) 现在饮酒 2926(33.97) 231(25.27) 吸烟状态[n(%)] <0.001 从不吸烟 5165(59.97) 626(68.49) 过去吸烟 809(9.39) 72(7.88) 现在吸烟 2639(30.64) 216(23.63) 糖尿病[n(%)] <0.001 无 8110(94.16) 832(91.03) 有 503(5.84) 82(8.97) 卒中[n(%)] 0.003 无 8417(97.72) 878(96.06) 有 196(2.28) 36(3.94) WC(x±s, cm) 85.03±9.36 84.94±9.88 0.80 BMI(x±s, kg/m2) 23.43±3.28 23.58±3.54 0.230 WHtR(x±s) 0.54±0.06 0.55±0.07 <0.001 VAI(x±s) 2.07±1.80 2.29±2.01 0.002 ABSI*(x±s) 0.08±0.01 0.08±0.01 0.049 BRI(x±s) 4.17±1.24 4.38±1.34 <0.001 LAP(x±s) 35.87±29.41 39.19±32.20 0.003 CI(x±s) 1.28±0.08 1.29±0.09 0.030 CVAI(x±s) 96.73±36.98 98.71±36.92 0.120 TyG(x±s) 8.66±0.59 8.71±0.60 0.030 TyG-BMI(x±s, kg/m2) 203.53±35.09 205.94±37.86 0.070 TyG-WC(x±s, cm) 738.32±107.73 741.46±113.07 0.420 TyG-WHtR(x±s) 4.67±0.69 4.78±0.74 0.020*ABSI:两组数据分别是0.08278(0.00525)和0.08316(0.00570);WC、BMI、WHtR、VAI、ABSI、BRI、LAP、CI、CVAI、TyG、TyG-BMI、TyG-WC、TyG-WHtR:见表 1
表 3 13种肥胖及相关代谢指标与膝骨关节炎发病风险的相关性
Table 3 The association between 13 obesity and metabolic indicators and the risk of knee osteoarthritis incidence
指标 OR(95% CI) P值 模型1 模型2 模型3 OR(95% CI) P值 OR(95% CI) P值 OR(95% CI) P值 肥胖指标 WC 0.99(0.92~1.06) 0.780 1.04(0.97~1.12) 0.270 1.05(0.97~1.13) 0.20 1.03(0.96~1.11) 0.430 BMI 1.01(0.99~1.03) 0.20 1.03(1.004~1.05) 0.020 1.03(1.01~1.05) 0.010 1.02(1.00~1.04) 0.048 WHtR 1.29(1.15~1.44) <0.001 1.14(1.02~1.29) 0.030 1.15(1.03~1.30) 0.020 1.13(0.999~1.27) 0.052 VAI 1.06(1.03~1.10) <0.001 1.04(1.002~1.08) 0.040 1.04(1.01~1.08) 0.020 1.03(0.997~1.07) 0.070 ABSI 1.15(1.01~1.31) 0.040 0.98(0.86~1.12) 0.770 0.98(0.86~1.12) 0.770 0.98(0.86~1.12) 0.740 BRI 1.14(1.08~1.20) <0.001 1.07(1.01~1.14) 0.010 1.08(1.02~1.14) 0.009 1.06(1.01~1.13) 0.030 LAP 1.04(1.01~1.06) 0.001 1.03(1.01~1.05) 0.009 1.03(1.01~1.06) 0.004 1.03(1.00~1.05) 0.020 CI 1.10(1.02~1.20) 0.020 1.02(0.94~1.11) 0.590 1.02(0.94~1.11) 0.590 1.01(0.93~1.10) 0.780 CVAI 1.01(0.996~1.03) 0.120 1.01(0.99~1.04) 0.110 1.02(0.996~1.04) 0.110 1.01(0.99~1.03) 0.290 代谢指标 TyG 1.13(1.01~1.27) 0.030 1.15(1.02~1.29) 0.020 1.16(1.03~1.30) 0.020 1.10(0.98~1.24) 0.110 TyG-BMI 1.02(0.96~1.09) 0.050 1.03(1.01~1.05) 0.004 1.03(1.01~1.05) 0.002 1.02(1.00~1.05) 0.020 TyG-WC 1.03(0.96~1.09) 0.40 1.07(0.99~1.14) 0.051 1.07(1.01~1.15) 0.030 1.05(0.98~1.12) 0.170 TyG-WHtR 1.25(1.13~1.37) <0.001 1.16(1.05~1.28) 0.005 1.17(1.06~1.30) 0.003 1.13(1.02~1.25) 0.020 模型1校正年龄、性别、教育程度、婚姻状况和居住地;模型2在模型1的基础上校正了运动状态、饮酒和吸烟状态;模型3在模型2的基础上校正了糖尿病和卒中;WC、BMI、WHtR、VAI、ABSI、BRI、LAP、CI、CVAI、TyG、TyG-BMI、TyG-WC、TyG-WHtR:同表 1表 4 不同性别13种肥胖及相关代谢指标与膝骨关节炎的相关性分析[OR(95% CI)]
Table 4 Associations between 13 obesity and metabolic indicators and knee osteoarthritis across different sexes[OR(95% CI)]
指标 男性(n=4452) 女性(n=5075) P值 肥胖指标 WC 0.92(0.80~1.05) 1.09(0.99~1.19) 0.010 BMI 0.99(0.96~1.04) 1.03(1.01~1.06)* 0.130 WHtR 1.02(0.81~1.28) 1.18(1.02~1.36)* 0.130 VAI 1.02(0.94~1.11) 1.04(0.99~1.08) 0.580 ABSI 0.88(0.68~1.14) 1.02(0.87~1.20) 0.160 BRI 1.02(0.9~1.14) 1.08(1.01~1.16)* 0.150 LAP 1.01(0.96~1.06) 1.03(1.01~1.06)* 0.220 CI 0.93(0.79~1.09) 1.05(0.95~1.16) 0.070 CVAI 0.98(0.95~1.01) 1.04(1.01~1.07)* 0.002 代谢指标 TyG 1.01(0.82~1.24) 1.15(0.99~1.34) 0.170 TyG-BMI 1.00(0.97~1.04) 1.03(1.01~1.06)* 0.090 TyG-WC 0.95(0.85~1.08) 1.10(1.01~1.19)* 0.020 TyG-WHtR 1.03(0.85~1.25) 1.18(1.04~1.34)* 0.10 模型校正了年龄、性别、教育程度、婚姻状况、居住地、运动状态、饮酒和吸烟状态、糖尿病和卒中等协变量;* P<0.05;P值为多因素Logistic回归模型中交互项(指标×性别)系数的Wald检验结果表 5 部分肥胖及相关代谢指标对膝骨关节炎的诊断效能评估
Table 5 ROC curve analysis results of obesity and related metabolic indicators for knee osteoarthritis prediction
指标 AUC(95% CI) 最佳截断值 敏感度
(%) 特异度
(%) BRI 0.547(0.526~0.567) 4.392 48.5 59.9 TyG-WHtR 0.544(0.524~0.564) 4.602 58.3 48.9 LAP 0.530(0.510~0.550) 4.079 36.9 68.8 TyG-BMI 0.515(0.495~0.535) 20.847 44.7 58.9 BMI 0.510(0.489~0.531) 24.879 35.7 68.4 AUC(area under the curve):曲线下面积;BRI、TyG-WHtR、LAP、TyG-BMI、BMI:同表 1 [1]
Long H B, Liu Q, Yin H Y, et al. Prevalence trends of site-specific osteoarthritis from 1990 to 2019: findings from the global burden of disease study 2019[J]. Arthritis Rheumatol, 2022, 74(7): 1172-1183. DOI: 10.1002/art.42089
[2]Li D H, Li S J, Chen Q, et al. The prevalence of symptomatic knee osteoarthritis in relation to age, sex, area, region, and body mass index in China: a systematic review and meta-analysis[J]. Front Med (Lausanne), 2020, 7: 304.
[3]Li H Z, Liang X Z, Sun Y Q, et al. Global, regional, and national burdens of osteoarthritis from 1990 to 2021: findings from the 2021 global burden of disease study[J]. Front Med (Lausanne), 2024, 11: 1476853.
[4]Chen L, Zhang Z, Liu X Y. Role and mechanism of mechanical load in the homeostasis of the subchondral bone in knee osteoarthritis: a comprehensive review[J]. J Inflamm Res, 2024, 17: 9359-9378. DOI: 10.2147/JIR.S492415
[5]Liu Y L, Chen P, Hu B, et al. Excessive mechanical loading promotes osteoarthritis development by upregulating Rcn2[J]. Biochim Biophys Acta Mol Basis Dis, 2024, 1870(6): 167251. DOI: 10.1016/j.bbadis.2024.167251
[6]Lambova S N, Batsalova T, Moten D, et al. Serum leptin and resistin levels in knee osteoarthritis-clinical and radiologic links: towards precise definition of metabolic type knee osteoarthritis[J]. Biomedicines, 2021, 9(8): 1019. DOI: 10.3390/biomedicines9081019
[7]Sobieh B H, El-Mesallamy H O, Kassem D H. Beyond mechanical loading: the metabolic contribution of obesity in osteoarthritis unveils novel therapeutic targets[J]. Heliyon, 2023, 9(5): e15700. DOI: 10.1016/j.heliyon.2023.e15700
[8]Wallace K D. Older adults with elevated BMI are at greater risk of accelerated knee osteoarthritis: data from the osteoarthritis initiative[D]. Dayton: Wright State University, 2016.
[9]Amato M C, Giordano C, Galia M, et al. Visceral adiposity index: a reliable indicator of visceral fat function associated with cardiometabolic risk[J]. Diabetes Care, 2010, 33(4): 920-922. DOI: 10.2337/dc09-1825
[10]Kahn H S. The lipid accumulation product is better than BMI for identifying diabetes: a population-based comparison[J]. Diabetes Care, 2006, 29(1): 151-153. DOI: 10.2337/diacare.29.01.06.dc05-1805
[11]Kaya K, Gevher Ö. Isotretinoin increases non-insulin-based surrogate markers of insulin resistance in acne vulgaris patients[J]. Cutan Ocul Toxicol, 2024, 43(4): 410-415. DOI: 10.1080/15569527.2024.2424937
[12]Mansoori A, Allahyari M, Mirvahabi M S, et al. Predictive properties of novel anthropometric and biochemical indexes for prediction of cardiovascular risk[J]. Diabetol Metab Syndr, 2024, 16(1): 304. DOI: 10.1186/s13098-024-01516-4
[13]Sampath S J P, Venkatesan V, Ghosh S, et al. Obesity, metabolic syndrome, and osteoarthritis—an updated review[J]. Curr Obes Rep, 2023, 12(3): 308-331. DOI: 10.1007/s13679-023-00520-5
[14]Cai H R, Que Z Q, Chen J Z, et al. Association between different insulin resistance surrogates and osteoarthritis: a cross-sectional study from NHANES 1999—2018[J]. BMC Musculoskelet Disord, 2024, 25(1): 901. DOI: 10.1186/s12891-024-08027-3
[15]Zhao Y H, Hu Y S, Smith J P, et al. Cohort profile: the China Health and Retirement Longitudinal Study (CHARLS)[J]. Int J Epidemiol, 2014, 43(1): 61-68. DOI: 10.1093/ije/dys203
[16]Totaro M, Barchetta I, Sentinelli F, et al. Waist circumference, among metabolic syndrome components, predicts degraded trabecular bone score: a retrospective study of a female population from the 2005-2008 NHANES cohorts[J]. Front Endocrinol (Lausanne), 2024, 15: 1476751. DOI: 10.3389/fendo.2024.1476751
[17]Pichi F, Alali S H, Shehab R, et al. Impact of body mass index on adalimumab efficacy in pediatric juvenile idiopathic arthritis-associated uveitis[J]. Ophthalmology, 2025, 132(11): 1320-1322. DOI: 10.1016/j.ophtha.2024.12.009
[18]Zhai Y J, Lin C Y, Li J B, et al. Mediating role of triglyceride-glucose index and its derivatives in the relationship between central obesity and Hashimoto thyroiditis in type 2 diabetes[J]. Lipids Health Dis, 2024, 23(1): 411. DOI: 10.1186/s12944-024-02402-8
[19]He X Y, Liang F X, Guo Y W, et al. Relationship between a body shape index and self-reported stress urinary incontinence among US women: a cross-sectional analysis[J]. Int Urogynecol J, 2025, 36(5): 981-989. DOI: 10.1007/s00192-024-06001-0
[20]Zhang Y Y, Shi M Y, Dong Z, et al. Impact of Chinese visceral adiposity index on all-cause mortality risk in community-dwelling older adults: a prospective cohort study[J]. Aging Clin Exp Res, 2024, 36(1): 230. DOI: 10.1007/s40520-024-02891-8
[21]Raud B, Gay C, Guiguet-Auclair C, et al. Level of obesity is directly associated with the clinical and functional consequences of knee osteoarthritis[J]. Sci Rep, 2020, 10(1): 3601. DOI: 10.1038/s41598-020-60587-1
[22]Jindal K, Dhatt S S, Dhillon M S. Is obesity significantly related to early onset and progression of knee osteoarthritis?[J]. J Postgrad Med Educ Res, 2021, 55(1): 36-38. DOI: 10.5005/jp-journals-10028-1428
[23]Huang J, Han J H, Rozi R, et al. Association between lipid accumulation products and osteoarthritis among adults in the United States: a cross-sectional study, NHANES 2017—2020[J]. Prev Med, 2024, 180: 107861. DOI: 10.1016/j.ypmed.2024.107861
[24]Liang H Z, Si W Y, Li L, et al. Association between body roundness index and osteoarthritis: a cross-sectional analysis of NHANES 2011—2018[J]. Front Nutr, 2024, 11: 1501722. DOI: 10.3389/fnut.2024.1501722
[25]Lu Y W, Chang C C, Chou R H, et al. Gender difference in the association between TyG index and subclinical atherosclerosis: results from the Ⅰ-Lan Longitudinal Aging Study[J]. Cardiovasc Diabetol, 2021, 20(1): 206. DOI: 10.1186/s12933-021-01391-7
[26]Zhou Z J, Liu Q, Zheng M, et al. Comparative study on the predictive value of TG/HDL-C, TyG and TyG-BMI indices for 5-year mortality in critically ill patients with chronic heart failure: a retrospective study[J]. Cardiovasc Diabetol, 2024, 23(1): 213. DOI: 10.1186/s12933-024-02308-w
[27]Zhou J, Huang H, Huang H, et al. Association of triglyceride-glucose index and its combination with adiposity-related indices with the incidence of myocardial infarction: a cohort study from the UK Biobank[J]. Int J Obes, 2024, 48(10): 1498-1505.
[28]Lee R, Kean W F. Obesity and knee osteoarthritis[J]. Inflammopharmacology, 2012, 20(2): 53-58. DOI: 10.1007/s10787-011-0118-0
[29]Kayll S A, Hinman R S, Bryant A L, et al. Do biomechanical foot-based interventions reduce patellofemoral joint loads in adults with and without patellofemoral pain or osteoar-thritis? A systematic review and meta-analysis[J]. Br J Sports Med, 2023, 57(13): 872-881. DOI: 10.1136/bjsports-2022-106542
[30]Wang T T, He C Q. Pro-inflammatory cytokines: the link between obesity and osteoarthritis[J]. Cytokine Growth Factor Rev, 2018, 44: 38-50. DOI: 10.1016/j.cytogfr.2018.10.002
[31]Xie C X, Chen Q. Adipokines: new therapeutic target for osteoarthritis?[J]. Curr Rheumatol Rep, 2019, 21(12): 71. DOI: 10.1007/s11926-019-0868-z
[32]Ribeiro M, López De Figueroa P, Blanco F J, et al. Insulin decreases autophagy and leads to cartilage degradation[J]. Osteoarthritis Cartilage, 2016, 24(4): 731-739. DOI: 10.1016/j.joca.2015.10.017
[33]Tchetina E V, Markova G A, Sharapova E P. Insulin resistance in osteoarthritis: similar mechanisms to type 2 diabetes mellitus[J]. J Nutr Metab, 2020, 2020: 4143802.
[34]Sasono B, Rantam F A, Suroto H, et al. The effect of estrogen on type 2 collagen levels in the joint cartilage of post-menopausal murine subjects[J]. J Hard Tissue Biol, 2019, 28(3): 245-250. DOI: 10.2485/jhtb.28.245
[35]Khalaf M S. The leptin level in development of knee osteoarthritis disease[J]. J Univ Shanghai Sci Technol, 2021, 23(6): 1102-1105.
[36]Mohammed D A. Evaluation and relation between inflam-matory marker (Leptin) level and knee osteoarthritis (KOA) disease[J]. J Univ Shanghai Sci Technol, 2022, 24(1): 310-314.
[37]Oussaada S M, Kilicarslan M, de Weijer B A, et al. Tissue-specific inflammation and insulin sensitivity in subjects with obesity[J]. Diabetes Res Clin Pract, 2024, 211: 111663. DOI: 10.1016/j.diabres.2024.111663
[38]Henstridge D C, Abildgaard J, Lindegaard B, et al. Metabolic control and sex: a focus on inflammatory-linked mediators[J]. Br J Pharmacol, 2019, 176(21): 4193-4207. DOI: 10.1111/bph.14642
[39]Dell'isola A, Wirth W, Steultjens M, et al. Knee extensor muscle weakness and radiographic knee osteoarthritis progression[J]. Acta Orthop, 2018, 89(4): 406-411. DOI: 10.1080/17453674.2018.1464314
[40]Bartsch A, Anderson F L, Fredericson M, et al. Biomechanical and biological factors of sexual dimorphism in anterior knee pain: current concepts[J]. J ISAKOS, 2024, 9(4): 788-793. DOI: 10.1016/j.jisako.2024.05.014
[41]Dawson J, Juszczak E, Thorogood M, et al. An investigation of risk factors for symptomatic osteoarthritis of the knee in women using a life course approach[J]. J Epidemiol Community Health, 2003, 57(10): 823-830. DOI: 10.1136/jech.57.10.823
[42]Konstari S, Sääksjärvi K, Heliövaara M, et al. Associations of metabolic syndrome and its components with the risk of incident knee osteoarthritis leading to hospitalization: a 32-year follow-up study[J]. Cartilage, 2021, 13(S1): 1445S-1456S.
[43]Franklin J, Ingvarsson T, Englund M, et al. Sex differences in the association between body mass index and total hip or knee joint replacement resulting from osteoarthritis[J]. Ann Rheum Dis, 2009, 68(4): 536-540. DOI: 10.1136/ard.2007.086868
相关知识
肥胖及相关代谢指标与膝骨关节炎的关联: 基于中国中老年人群的横断面研究
膝关节骨性关节炎
30年横断面研究揭示中国成人膳食转变与代谢性疾病的关系
中国中老年人综合生活方式与心脏代谢性共病之间的关联性探究:基于CHARLS的横断面研究
Arthritis Rheumatol:适度减重对膝关节与髋关节骨关节炎患者的生存益处:一项基于减肥药物干预的研究@MedSci
【中国科学报】研究发现婴儿肠道菌群及代谢物与肥胖相关
健康中国背景下膝关节炎人群水中健身的策略研究
基于肌骨超声评价“贺氏针灸三通法”治疗膝骨关节炎的临床研究*
膝骨关节炎诊疗系统——老年人居家康复利器
A&R:体重指数与疼痛的关联以及炎症生物标志物在手骨关节炎患者中的中介作用
网址: 肥胖及相关代谢指标与膝骨关节炎的关联: 基于中国中老年人群的横断面研究 https://www.trfsz.com/newsview1898669.html
推荐资讯


- 1发朋友圈对老公彻底失望的心情 12775
- 2BMI体重指数计算公式是什么 11235
- 3补肾吃什么 补肾最佳食物推荐 11199
- 4性生活姿势有哪些 盘点夫妻性 10428
- 5BMI正常值范围一般是多少? 10137
- 6在线基础代谢率(BMR)计算 9652
- 7一边做饭一边躁狂怎么办 9138
- 8从出汗看健康 出汗透露你的健 9063
- 9早上怎么喝水最健康? 8613
- 10五大原因危害女性健康 如何保 7828