膳食纤维摄入量与高血压的关系:基于2015—2016年美国国家健康与营养调查数据库(NHANES)的分析
摘要:
方法
采用美国国家健康与营养调查数据库(National Health and Nutrition Examination Survey, NHANES)2015—2016年的数据,将24 h膳食回顾法收集的饮食数据与美国农业部食品和营养数据库相结合计算膳食纤维摄入量;通过问卷调查和移动中心检测的血压数值定义高血压。采用logistic回归模型分析年龄≥18岁人群的膳食纤维摄入量与高血压的关系,采用广义相加模型(generalized additive model, GAM)、平滑曲线拟合分析两者间的剂量-反应关系。
结果
与低膳食纤维摄入者(膳食纤维摄入量<11.75 g/d)相比,在总人群中,高膳食纤维摄入者(膳食纤维摄入量≥18.85 g/d)高血压的患病风险下降18%(OR=0.82,95%CI 0.68~0.98)。男性人群中,高膳食纤维摄入者高血压的患病风险下降23%(OR=0.77,95%CI 0.60~0.98);女性人群中,当膳食纤维摄入量>28.05 g/d时,膳食纤维摄入量每增加1 g/d,高血压的患病风险下降6%(OR=0.94,95%CI 0.89~0.99)。年龄>60岁人群中,高膳食纤维摄入者高血压的患病风险下降31%(OR=0.69,95%CI 0.48~0.99);年龄≤45岁人群中,膳食纤维摄入>34.5 g/d时,膳食纤维摄入量每增加1 g/d,高血压的患病风险下降6%(OR=0.94,95%CI 0.88~0.99)。
结论
高膳食纤维摄入与高血压患病风险下降有关,合理增加膳食纤维摄入有助于降低高血压的发生。
Abstract:
Objective
To explore the relationship between dietary fiber intake and hypertension in different populations.
Methods
Dietary fiber intake was calculated using the data from 2015—2016 National Health and Nutrition Examination Survey (NHANES) database by combining dietary data collected by the 24-hour dietary recall method with the USDA Food and Nutritional Database. Hypertension was defined based on blood pressure values obtained through questionnaires and mobile center measurements. Logistic regression models were used to analyze the relationship between dietary fiber intake and hypertension in individuals aged ≥18 years. Generalized additive model (GAM) and smoothed curve fitting were used to analyze the dose-response relationship between them.
Results
Compared with the low dietary fiber intake (<17.75 g/d) group , in the total population, the prevalence risk of hypertension was 18% lower in the high dietary fiber intake (≥18.85 g/d) group (OR=0.82, 95%CI 0.68-0.98). In the male population, the risk of hypertension in the high dietary fiber intake group decreased by 23% (OR=0.77, 95%CI 0.60-0.98). In the female population, when dietary fiber intake was >28.05 g/d, the risk of hypertension decreased by 6% (OR=0.94, 95%CI 0.89-0.99) for 1 g/d increase in dietary fiber intake. In the population aged >60 years, the risk of hypertension decreased by 31% in the high dietary fiber intake group (OR=0.69, 95%CI 0.48-0.99). In the population aged ≤45 years, the risk of hypertension decreased by 6% (OR=0.94, 95%CI 0.88-0.99) for 1 g/d increase when dietary fiber intake >34.5 g/d.
Conclusions
High dietary fiber intake is associated with a decreased risk of developing hypertension, and a reasonable increase in dietary fiber intake can help reduce the incidence of hypertension.
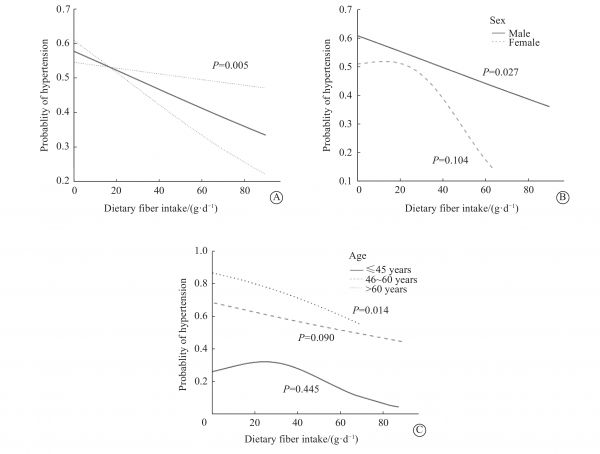
图 1 膳食纤维摄入量与高血压之间的剂量-反应关系
Figure 1. Dose-response relationship between dietary fiber intake and hypertension
A: In total population. The solid line and dashed line represent the estimated ORs and the corresponding 95% confidence intervals, respectively. B: In different sex group. C: In different age group. Adjusted for age, sex, race, education, hyperlipidemia, diabetes, smoking history, drinking history, body mass index, sedentary time, household income, sodium intake. In each stratification analysis, the model did not repeat to adjust for that stratification variable.
表 1 调查对象的基本特征
Table 1 Basic characteristics of the subjects of study
Characteristic Non-hypertension group(n=2 135) Hypertension group(n=2 432) χ2/t/u P Age/years 38.85±16.24 56.71±16.04 37.318 <0.001 TG/(mg•dL−1) 80.00(15.00-770.00) 100.00(18.00-1 761.00) −8.060 <0.001 TC/(mg•dL−1) 184.34±38.90 192.61±43.10 6.656 0.001 HDL-C/(mg•dL−1) 54.59±16.51 53.18±18.06 −2.699 0.007 LDL-C/(mg•dL−1) 109.36±33.27 113.36±37.49 2.478 0.013 FBG/(mg•dL−1) 101.34±23.41 120.27±48.65 11.493 <0.001 Dietary fiber intake/(g•d−1) 15.25(0.30-86.80) 14.70(0.40-89.55) −2.236 0.025 Sedentary time/(min•d−1) 360.00(1.00-1 200.00) 360.00(0-1 380.00) −0.024 0.981 Sex n(%) 11.802 0.001 Male 1 000(46.84) 1 263(51.93) Female 1 135(53.16) 1 169(48.07) Race n(%) 34.089 <0.001 Mexican American 411(19.25) 399(16.41) Other Hispanic 275(12.88) 303(12.46) Non-Hispanic White 743(34.80) 859(35.32) Non-Hispanic Black 378(17.71) 577(23.72) Other Race 328(15.36) 294(12.09) Education n(%) −4.207 <0.001 Below high school 419(19.63) 616(25.33) High school 505(23.65) 559(22.99) Above high school 1 211(56.72) 1 257(51.68) Household income n(%) −7.131 <0.001 <20 000 dollars 418(19.57) 674(27.72) 20 000-44 999 dollars 656(30.73) 760(31.25) 45 000-64 999 dollars 336(15.74) 350(14.39) ≥65 000 dollars 725(33.96) 648(26.64) Diabetes n(%) 124(5.81) 528(21.71) 234.935 <0.001 Smoking history n(%) 752(35.22) 1 169(48.07) 76.973 <0.001 Drinking history n(%) 1 448(67.82) 1 649(67.80) <0.001 0.990 BMI n(%) −14.800 <0.001 ≤24.9 kg/m2 795(37.24) 467(19.20) >24.9-29.9 kg/m2 676(31.66) 769(31.62) >29.9 kg/m2 664(31.10) [20]LU K, YU T Q, CAO X Y, et al. Effect of viscous soluble dietary fiber on glucose and lipid metabolism in patients with type 2 diabetes mellitus: a systematic review and meta-analysis on randomized clinical trials[J]. Front Nutr, 2023, 10: 1253312. DOI: 10.3389/fnut.2023.1253312
[21]RATANACHAMNONG P, PHIVTHONG-NGAM L, NAMCHAIW P. Daily White kwao krua dietary supplement alleviates LDL oxidative susceptibility, plasma LDL level and improves vasculature in a hypercholesterolemia rabbit model[J]. J Tradit Complement Med, 2020, 10(5): 496-503. DOI: 10.1016/j.jtcme.2020.05.001
[22]ALEIXANDRE A, MIGUEL M. Dietary fiber in the prevention and treatment of metabolic syndrome: a review[J]. Crit Rev Food Sci Nutr, 2008, 48(10): 905-912. DOI: 10.1080/10408390701761886
[23]HOWARTH N C, SALTZMAN E, ROBERTS S B. Dietary fiber and weight regulation[J]. Nutr Rev, 2001, 59(5): 129-139.
[24]JANG S Y, KIM J, KIM S, et al. Impact of anthropometric indices of obesity on the risk of incident hypertension in adults with prehypertension: a secondary analysis of a cohort study[J]. J Korean Acad Nurs, 2024, 54(1): 18-31. DOI: 10.4040/jkan.23067
[25]MURALITHARAN R R, JAMA H A, XIE L, et al. Microbial peer pressure: the role of the gut microbiota in hypertension and its complications[J]. Hypertension, 2020, 76(6): 1674-1687. DOI: 10.1161/HYPERTENSIONAHA.120.14473
[26]XU C D, MARQUES F Z. How dietary fibre, acting via the gut microbiome, lowers blood pressure[J]. Curr Hypertens Rep, 2022, 24(11): 509-521. DOI: 10.1007/s11906-022-01216-2
[27]VISNIAUSKAS B, KILANOWSKI-DOROH I, OGOLA B O, et al. Estrogen-mediated mechanisms in hypertension and other cardiovascular diseases[J]. J Hum Hypertens, 2023, 37(8): 609-618.
[28]IRWIG M S. Hypertension in transgender individuals[J]. J Hum Hypertens, 2023, 37(8): 689-693.
[29]GANN P H, CHATTERTON R T, GAPSTUR S M, et al. The effects of a low-fat/high-fiber diet on sex hormone levels and menstrual cycling in premenopausal women: a 12-month randomized trial (the diet and hormone study)[J]. Cancer, 2003, 98(9): 1870-1879. DOI: 10.1002/cncr.11735
[30]WIGGS A G, CHANDLER J K, AKTAS A, et al. The effects of diet and exercise on endogenous estrogens and subsequent breast cancer risk in postmenopausal women[J]. Front Endocrinol, 2021, 12: 732255. DOI: 10.3389/fendo.2021.732255
[31]STREPPEL M T, ARENDS L R, VAN 'T VEER P, et al. Dietary fiber and blood pressure: a meta-analysis of randomized placebo-controlled trials[J]. Arch Intern Med, 2005, 165(2): 150-156. DOI: 10.1001/archinte.165.2.150
[32]DESQUILBET L, MARIOTTI F. Dose-response analyses using restricted cubic spline functions in public health research[J]. Stat Med, 2010, 29(9): 1037-1057. DOI: 10.1002/sim.3841
相关知识
营养摄入与女性不孕之间的关联:基于 NHANES 数据库的研究。,Journal of Obstetrics and Gynaecology
健康成年人群尿中对硝基酚水平对甲状腺功能的影响——基于美国NHANES数据库
提高中国居民维生素D推荐摄入量的科学依据
国内大数据与膳食营养健康的研究及应用进展
我国居民营养与健康现状地调查分析
膳食钾和钠的摄入量:生理需要量与心血管疾病预防
学龄前儿童营养与健康状况调查结果分析
体脂分布与肾结石之间的关联:来自美国人群的证据
2016中国健康大数据分析报告.ppt
城市养老机构老年人群营养及健康状况调查分析
网址: 膳食纤维摄入量与高血压的关系:基于2015—2016年美国国家健康与营养调查数据库(NHANES)的分析 https://www.trfsz.com/newsview717254.html
推荐资讯


- 1发朋友圈对老公彻底失望的心情 12775
- 2BMI体重指数计算公式是什么 11235
- 3补肾吃什么 补肾最佳食物推荐 11199
- 4性生活姿势有哪些 盘点夫妻性 10428
- 5BMI正常值范围一般是多少? 10137
- 6在线基础代谢率(BMR)计算 9652
- 7一边做饭一边躁狂怎么办 9138
- 8从出汗看健康 出汗透露你的健 9063
- 9早上怎么喝水最健康? 8613
- 10五大原因危害女性健康 如何保 7828